Overview
Overview shows how your costs moved over a period you choose, with a breakdown table that makes the charged items and the cost of each product or service clear.
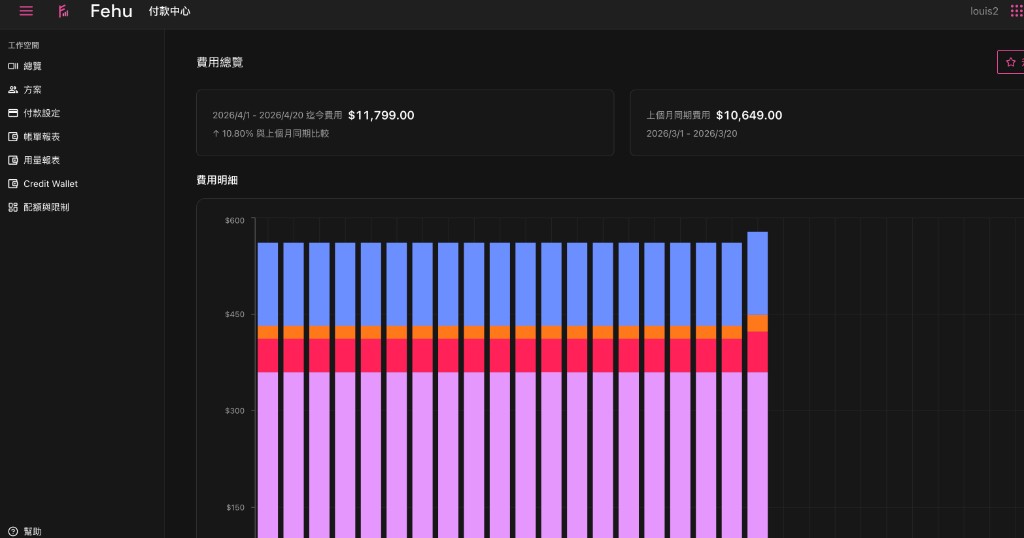
The summary cards
The top of the page summarises the period, for example the total for this period and how it compares with the last one. It is what tells you quickly whether costs have moved unusually.
The trend chart
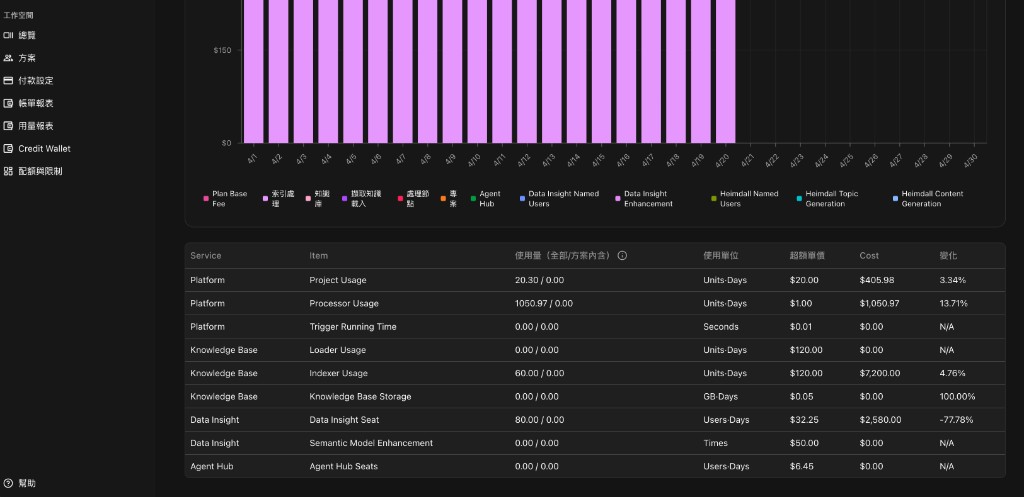
The trend chart plots cost against a date or a time range, colouring the sources separately (Platform, Knowledge Base, Data Insight, Agent Hub, Heimdall and so on; the actual categories are whatever the page shows).
The detail table
The table at the bottom of the page shows where each line of cost comes from and how it is measured. The usual columns:
- Service: the service the cost belongs to (Platform, Data Insight, Agent Hub and so on)
- Item: the charged item (Project Usage, Processor Usage, Seat and so on)
- Usage / Unit: how much was used and in what unit (Units·Days, GB·Days, Times)
- Cost: what that item cost
Next
- For monthly usage and units, go to Usage Reports.
- To find a bill for a period or download an invoice, go to Billing Reports.